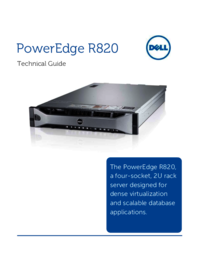
Dell PowerEdge R820 Manuel d'utilisateur
Naviguer en ligne ou télécharger Manuel d'utilisateur pour Mise en réseau Dell PowerEdge R820. Dell PowerEdge R820 vs. HP ProLiant DL585 G7 Manuel d'utilisatio
- Page / 18
- Table des matières
- MARQUE LIVRES


Résumé du contenu
PERFORMANCE AND TCO: DELL POWEREDGE R820 VS. HP PROLIANT DL585 G7 MAY 2012 A PRINCIPLED TECHNOLOGIES TEST REPORT Commissioned by Dell Inc. Making
A Principled Technologies test report 10 Performance and TCO: Dell PowerEdge R820 vs. HP ProLiant DL585 G7 5. On the Please Select a Keyboard Lay
A Principled Technologies test report 11 Performance and TCO: Dell PowerEdge R820 vs. HP ProLiant DL585 G7 8. Choose Windows, choose Microsoft Wi
A Principled Technologies test report 12 Performance and TCO: Dell PowerEdge R820 vs. HP ProLiant DL585 G7 b. Right-click the VM traffic NIC, and
A Principled Technologies test report 13 Performance and TCO: Dell PowerEdge R820 vs. HP ProLiant DL585 G7 26. After installation completes, click
A Principled Technologies test report 14 Performance and TCO: Dell PowerEdge R820 vs. HP ProLiant DL585 G7 5. We loaded the data we generated int
A Principled Technologies test report 15 Performance and TCO: Dell PowerEdge R820 vs. HP ProLiant DL585 G7 After making these changes, we recompil
A Principled Technologies test report 16 Performance and TCO: Dell PowerEdge R820 vs. HP ProLiant DL585 G7 APPENDIX C – TCO CALCULATIONS AND ASSUM
A Principled Technologies test report 17 Performance and TCO: Dell PowerEdge R820 vs. HP ProLiant DL585 G7 Power utilization Dell PowerEdge R820
A Principled Technologies test report 18 Performance and TCO: Dell PowerEdge R820 vs. HP ProLiant DL585 G7 ABOUT PRINCIPLED TECHNOLOGIES Princip
A Principled Technologies test report 2 Performance and TCO: Dell PowerEdge R820 vs. HP ProLiant DL585 G7 INCREASE PERFORMANCE WHILE SAVING MONEY
A Principled Technologies test report 3 Performance and TCO: Dell PowerEdge R820 vs. HP ProLiant DL585 G7 Figure 2: The Dell PowerEdge R820 delive
A Principled Technologies test report 4 Performance and TCO: Dell PowerEdge R820 vs. HP ProLiant DL585 G7 data center. We discuss our test results
A Principled Technologies test report 5 Performance and TCO: Dell PowerEdge R820 vs. HP ProLiant DL585 G7 Figure 5 shows the savings that the Dell
A Principled Technologies test report 6 Performance and TCO: Dell PowerEdge R820 vs. HP ProLiant DL585 G7 Figure 7 presents CPU utilization and po
A Principled Technologies test report 7 Performance and TCO: Dell PowerEdge R820 vs. HP ProLiant DL585 G7 APPENDIX A – SERVER CONFIGURATION INFORM
A Principled Technologies test report 8 Performance and TCO: Dell PowerEdge R820 vs. HP ProLiant DL585 G7 System Dell PowerEdge R820 HP ProLiant D
A Principled Technologies test report 9 Performance and TCO: Dell PowerEdge R820 vs. HP ProLiant DL585 G7 APPENDIX B - HOW WE TESTED Figure 9 illu
Plus de documents pour Mise en réseau Dell PowerEdge R820


 (6 pages)
 (16 pages)


Commentaires sur ces manuels